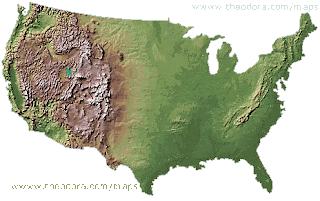
This map uses a hypsometric color display to show elevation. In this case the darker green areas are closer to sea level with the progressively brown to tan to white areas marking higher to higher elevations. This map shows only the contiguous United states. In reality the slope continues under sea level to deep sea trenches. Maps that do show underwater topography usually use light blue to denote sea level with progressively darker shades of blue showing increasing depth.
The above image can be found at www.theodora.com/maps/new9/usa_elevation_map.gif
No comments:
Post a Comment