skip to main | skip to sidebar

Maps of David

Friday, July 25, 2008

Isopeth

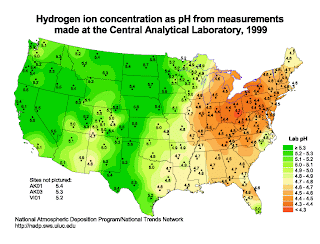
The above isopleth map, found at www.epa.gov/CASTNET/deposition.html, shows the average PH of rainfall across the US. Maps such as these help those studying the effects of acid rain and human-environment interactions.
Posted by David Schuknecht at 12:24 PM

No comments:

Post a Comment

Newer Post Older Post Home
Subscribe to: Post Comments (Atom)

Blog Archive

  • ▼  2008 (54)
    • ▼  July (46)
      • Star Plot
      • Correlation Matrix
      • Similarity Matrix
      • Stem and Leaf Plot
      • Box Plot
      • Histogram
      • Parallel Coordinate Graph
      • Triangular Plot
      • Windrose
      • Climograph
      • Population Profile
      • Scatterplot
      • Index Value Plot
      • Accumulative Line Graph or Lorenz Curve
      • Bilateral Graph
      • Nominal Area Choropleth Map
      • Unstandardized Choropleth Map
      • Standardized Choropleth Map
      • Univariate Choropleth Map
      • Bivariate Choropleth Map
      • The above image, the well-known "Purple America" m...
      • Classed Choropleth Maps
      • Range Graded Proportional Circle Map
      • Continuously Variable Proportional Circle Map
      • Digital Orthophoto Quarter Quadrangle (DOQQ)
      • Digital Elevation Model (DEM)
      • Digital Line Graph (DLG)
      • Digital Raster Graphic (DRG)
      • Isopeth
      • Isoplaths
      • Isohyets
      • Isotachs
      • Isobars
      • LIDAR IMAGE Black and White Aerial Photo The image...
      • Doppler Radar
      • Black and White Aerial Photo
      • Infrared Aerial Photo
      • Cartographic Animation
      • Statistical Map
      • Flow Map
      • Cartogram
      • Isoline Map
      • Proportional Circle Map
      • Choropleth Map
      • Dot Distribution Map
      • Propaganda Map
    • ►  June (4)
    • ►  May (4)

About Me

David Schuknecht
View my complete profile