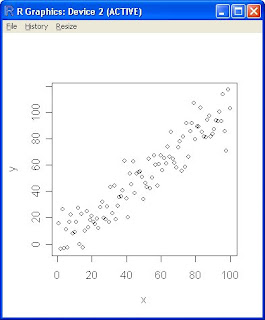
The above image, taken from http://www2.warwick.ac.uk/fac/sci/moac/degrees/modules/ch923/r_introduction/scatter_plots/, shows a basic scatter plot. This type of graph is used to determine relationship between two variables. The more in line (any direction) the dots are, the more of a correlation the two variables have.
No comments:
Post a Comment