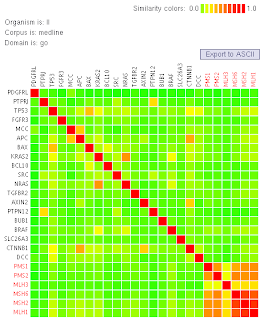
 The above image, taken from tomcat.esat.kuleuven.be/txtgate/tutorial.jsp, is a similarity matrix for selected genes from an organism. In this case dissimilar genes are indicated by green and higher levels of similarity (in terms of number of building-block clusters-DNA sequences) are indicated by increasing intensities of yellow-orange-red. The solid red line indicates where a given gene intersects itself (100% similarity). There is a grouping of similarity at the lower right, but also some individual similarities scattered around the matrix.
Wednesday, July 30, 2008
Similarity Matrix
 The above image, taken from tomcat.esat.kuleuven.be/txtgate/tutorial.jsp, is a similarity matrix for selected genes from an organism. In this case dissimilar genes are indicated by green and higher levels of similarity (in terms of number of building-block clusters-DNA sequences) are indicated by increasing intensities of yellow-orange-red. The solid red line indicates where a given gene intersects itself (100% similarity). There is a grouping of similarity at the lower right, but also some individual similarities scattered around the matrix.
Subscribe to:
Post Comments (Atom)
No comments:
Post a Comment