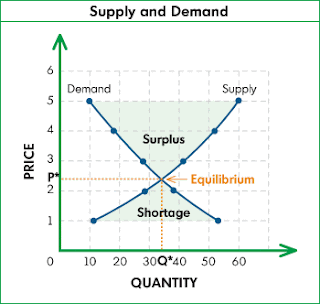
The above image, taken from http://sworlandoblog.com/2008/04/01/orlando-has-the-most-number-of-vacant-homes/, shows a bilateral graph depicting supply and demand levels in a particular market. (in this case the market in question was the home market in the Orlando, Fl area) Because, at least in part, the quantity and price are dependent on one another, this type of graph allows users to predict and interpret the market. As shown, if either price or supply fall below equilibrium, the market will be in a shortage situation, the market will then correct by either raising production or raising prices (and thereby reducing demand). This is one example of the bilateral graph that most people are probably familiar with.
No comments:
Post a Comment