 The above image, taken from http://personales.upv.es/gbenet/teoria%20del%20color/water_color/IMG/maxwell.gif, shows a triangular plot area for three variables. In this case the graph depicts the colors red, blue, and yellow and the combinations of the three. In this type if triangular graph each variable has its own axis but the graph remains on a single plane.
Wednesday, July 30, 2008
Triangular Plot
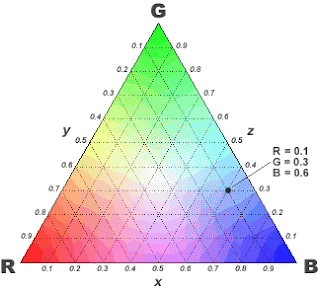
 The above image, taken from http://personales.upv.es/gbenet/teoria%20del%20color/water_color/IMG/maxwell.gif, shows a triangular plot area for three variables. In this case the graph depicts the colors red, blue, and yellow and the combinations of the three. In this type if triangular graph each variable has its own axis but the graph remains on a single plane.
Subscribe to:
Post Comments (Atom)
No comments:
Post a Comment