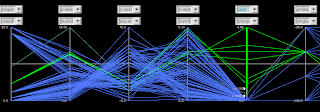
The above image, taken from http://www.geovista.psu.edu/publications/JSM99/Image53.gif, shows a parallel coordinate graph for a weather phenomenon. The crater has chosen to highlight the green data tracks in order to bring forward the information presented. This type of graph can help users find trends and commonalities between separate data streams that might otherwise go unseen. For instances, there is a grouping of the green lines at the last coordinate that may need some attention on this graph.
No comments:
Post a Comment