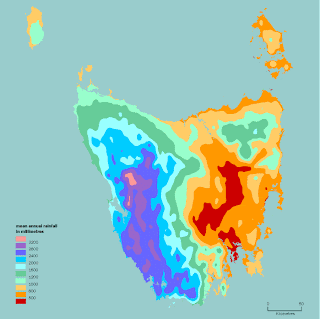
 The above image, found at http://soer.justice.tas.gov.au/2003/image/265/index.php, shows the annual precipitation in Tasmania. The isohyets, or lines of same rainfall, are marked by the change of one color to another. In this map the areas of lowest precipitation are marked with red and gradually move up a scale (shown at the bottom left) through orange, greens, blues, and purples. This map illustrates the wide range of rainfall that can be found on this landmass.
Friday, July 25, 2008
Isohyets
 The above image, found at http://soer.justice.tas.gov.au/2003/image/265/index.php, shows the annual precipitation in Tasmania. The isohyets, or lines of same rainfall, are marked by the change of one color to another. In this map the areas of lowest precipitation are marked with red and gradually move up a scale (shown at the bottom left) through orange, greens, blues, and purples. This map illustrates the wide range of rainfall that can be found on this landmass.
Subscribe to:
Post Comments (Atom)
No comments:
Post a Comment