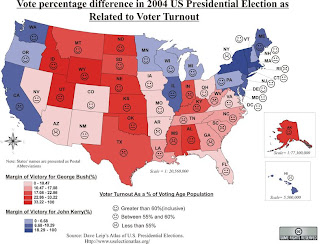
 The above image, taken from http://commons.wikimedia.org/wiki/Image:2004US_election_map.jpg, shows two separate variables. On one side you have the Republican/Democrat vote, represented by 8 classes of red to blue coloring within the state. You also have, depicted by the face icon, a three-class voter turn-out graphic.
Tuesday, July 29, 2008
Bivariate Choropleth Map
 The above image, taken from http://commons.wikimedia.org/wiki/Image:2004US_election_map.jpg, shows two separate variables. On one side you have the Republican/Democrat vote, represented by 8 classes of red to blue coloring within the state. You also have, depicted by the face icon, a three-class voter turn-out graphic.
Subscribe to:
Post Comments (Atom)
No comments:
Post a Comment