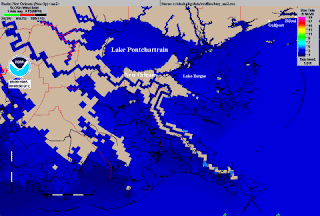
 The animated version can be found at http://flickr.com/photos/gisuser/38131105/
This animation, created by NOAA, is a sample model predicting what would transpire if hurricane Betsy (1965) were to hit the shore of Louisiana near St. Loise today. This is an example of multiple formulas and computations being formulated and put on a map in sequential order. The animation shows the progress of the incoming (and then outflowing) storm surge as the hurricane progresses and then relents.
No comments:
Post a Comment