 The above image, found at www.dnr.sc.gov/GIS/descdlg.html, is a Digital Line Graph representing Beaufort, South Carolina. This particular pap shows water flow patterns (ditches, creeks, etc) in blue. Roads and streets are shown in red. Also shown are the municipal boundaries for the city.
Tuesday, July 29, 2008
Digital Line Graph (DLG)
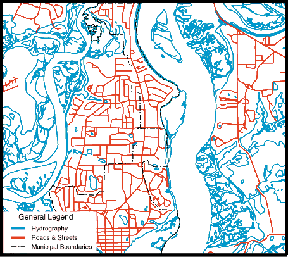
 The above image, found at www.dnr.sc.gov/GIS/descdlg.html, is a Digital Line Graph representing Beaufort, South Carolina. This particular pap shows water flow patterns (ditches, creeks, etc) in blue. Roads and streets are shown in red. Also shown are the municipal boundaries for the city.
Subscribe to:
Post Comments (Atom)
No comments:
Post a Comment